Choose the source of the data to view the statistics for. If you use multiple Turnitin products, pick the one which you would like to learn more about.
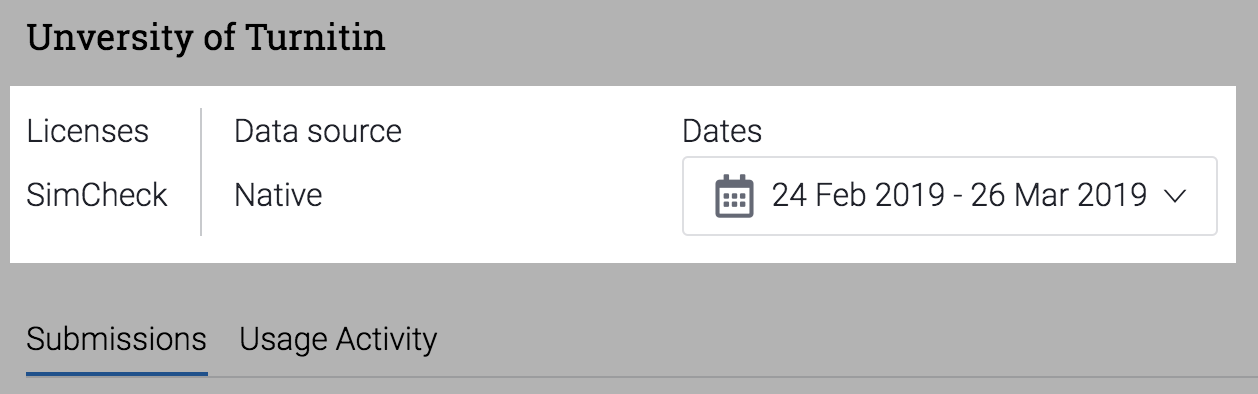
Looking for data from a specific date? Check our guide on how to filter by date.
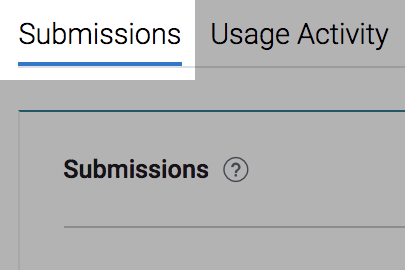
Navigate to the Submissions tab.
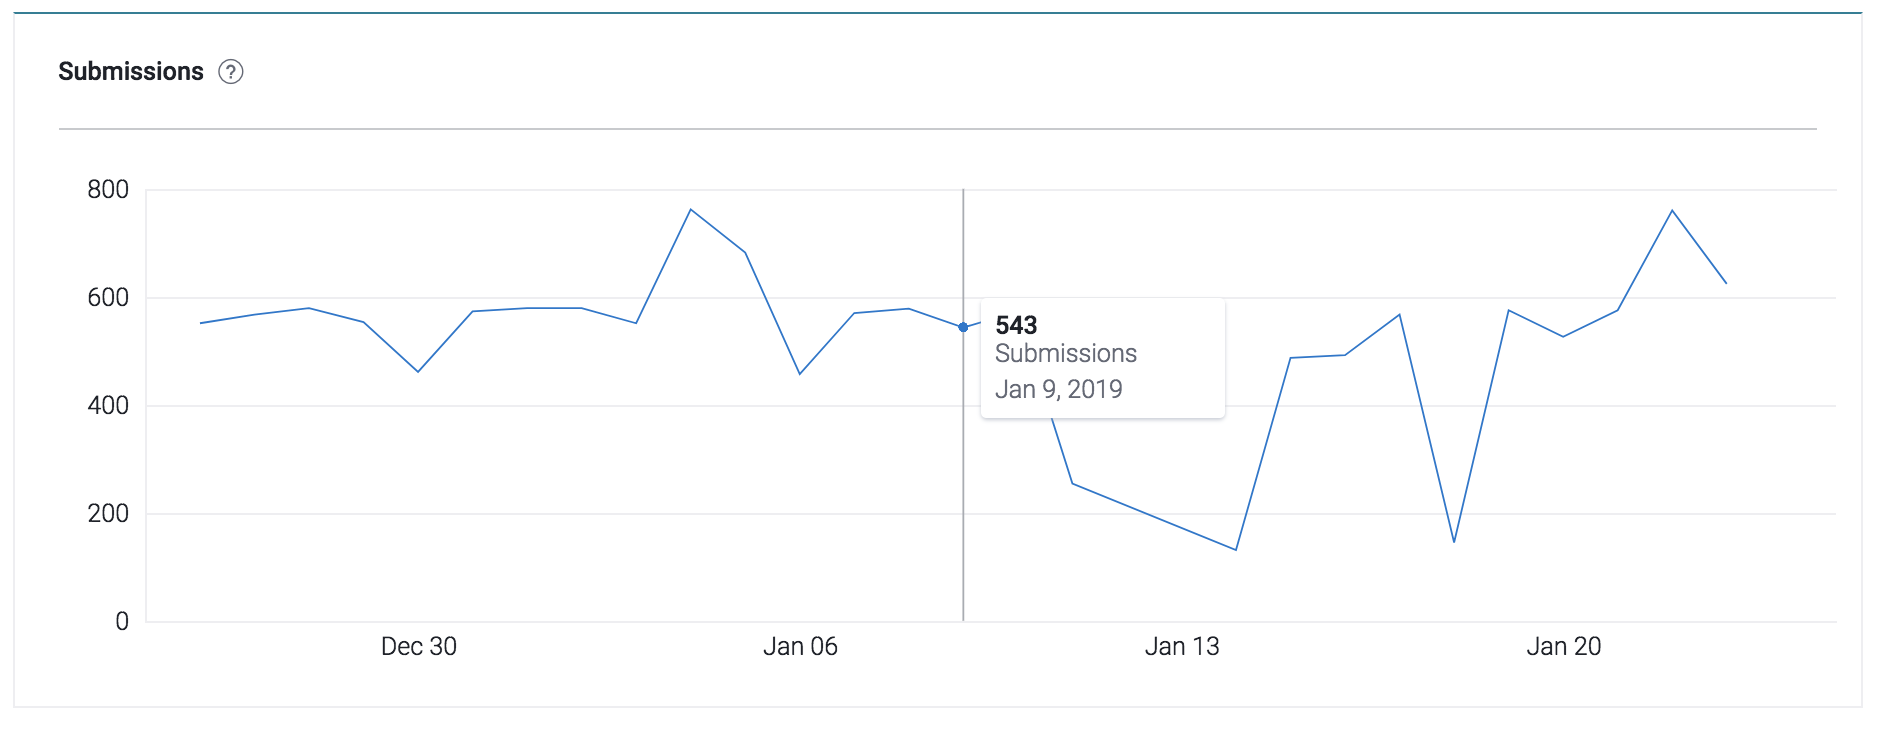
The submission chart shows you a visual representation of submissions that have successfully generated a similarity report during your specified date range. If you are interested in a numeric value, hover your mouse over the chart to view more detailed statistics.