The Modern Revolution
Grades 9-12 | Historical Analysis | Source-Based
Collaboration with BIG HISTORY PROJECT
Source Lexile®: 820L-1130L | Learning Standards
Prompt
To what extent has the Modern Revolution been a positive or a negative force?
The Modern Revolution is the most recent threshold of increasing complexity, according to David Christian. He argues that faster rates of innovation, new energy sources, and more complex networks of global exchange have made our world more complex and interesting, as well as more fragile and dangerous.
Expanding networks have accelerated collective learning, generated new technologies, and improved means of communication, transportation, and food production. These have had a dramatic impact on human life, linking the globe like never before and providing cures for some of the most life-threatening diseases. On average, people are living longer and have greater access to resources and education. However, the Modern Revolution has also brought great new weapons of destruction and new environmental threats.
Has the Modern Revolution been positive or negative? Has it been good or bad?
Use the provided documents and your understanding of the Modern Revolution to weigh its impact. Use what you learned about the Modern Revolution to write an essay in which you make a claim about whether the Modern Revolution has been a positive or a negative force. Make sure to state your position and show why you hold that position. In your essay, you should use:
- historical ideas and content
- acknowledgment of opposing viewpoints and why you reject them
- support for your thinking with logic and evidence
- a concluding paragraph to close your argument
Source 1
Population Trends
The following table shows global trends over the last 300 years in life expectancy, birth rates, and total population size. It also uses those trends to make future predictions to the year 2100 CE. Ronald Lee, an economics professor at the University of California, created this table. The first column shows life expectancy, or how long on average people will live. The second column shows birth rates, or the average number of births per woman. The last column shows the total size of the population in billions.
Global Population Trends, 1700–2100
| Life Expectancy (Years at Birth) |
Total Fertility Rate
(Births per Woman) |
Population Size
(Billions) |
|
|---|---|---|---|
| 1700 | 27 | 6.0 | .68 |
| 1800 | 27 | 6.0 | .98 |
| 1900 | 30 | 5.2 | 1.65 |
| 1950 | 47 | 5.0 | 2.52 |
| 2000 | 65 | 2.7 | 6.07 |
| 2050 | 74 | 2.0 | 8.92 |
| 2100 | 81 | 2.0 | 9.46 |
Source: Ronald Lee. “The Demographic Transition: Three Centuries of Fundamental Change,” Journal of Economic Perspectives 17, no.4 (Fall 2003): 167–90. Note: This table was slightly modified for use by the Big History Project.
Source 2
Urban Population Growth
From the dawn of agriculture, our ancestors lived a generally rural lifestyle. Most people did not live in cities or urban areas. For example, only 3 percent of the world's population lived in cities when the Modern Revolution was beginning in 1800. About 200 years later, more than half of the world's population was urban. Experts think that nearly 70 percent of the world's population will be urban by 2050.
Also, the number of cities in the world with a population of over 10 million people is growing. According to the United Nations publication World Urbanization Prospects: The 2011 Revision, only two cities in the world had a population greater than 10 million people in 1970. By 2011, that number had grown to 23.
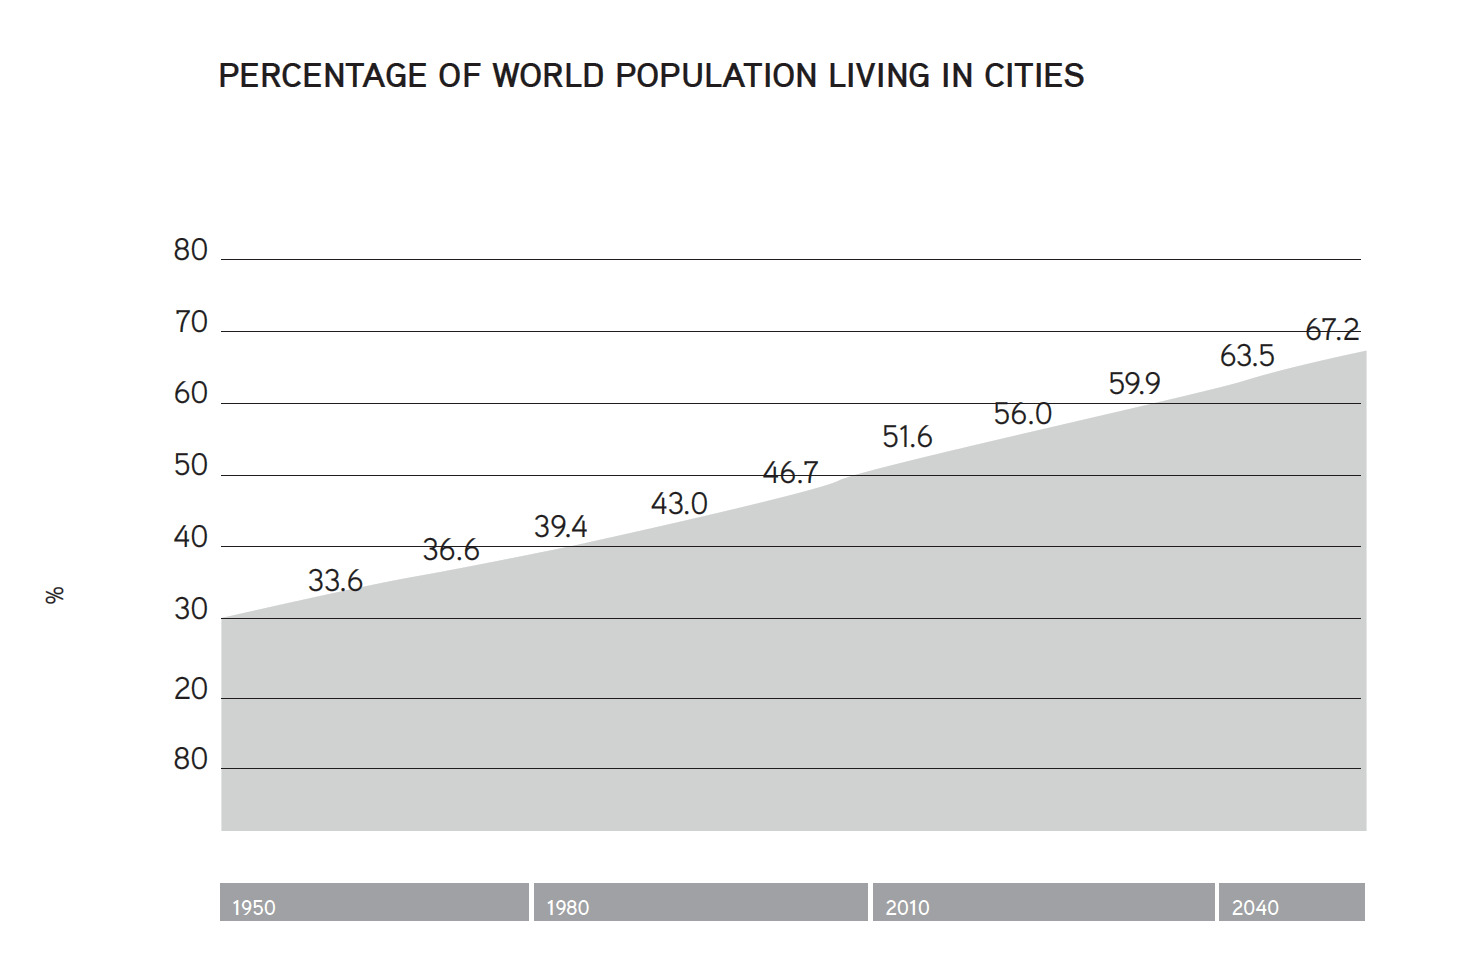
Source: Graph created using data from World Urbanization Prospects: The 2011 Revision, United Nations, Department of Economic and Social Affairs, Population Division, File 2.
Source 3
Literacy and Education
In 1850, only 10 percent of the world's population, or about 120 million people, could read and write. Today nearly 80 percent of the world's population, or about 5.1 billion people, are able to do some reading and writing. The percentage of people who are not literate, then, has decreased from 90 percent to about 20 percent in the last 160 years.
However, the actual number of illiterate people has increased. In 1850, there were about 1.08 billion people who could not read and write. Today there are about 1.28 billion people without literacy skills.
The growth in literacy has not been uniform across or within societies. For example, women are less literate than men: Worldwide – only 88 adult women are considered literate for every 100 adult men.
About 100 million children were not enrolled in primary school in 2002, 55 percent of them girls. The vast majority of the world's adult illiterates live in three regions: South and Southwest Asia, East Asia and the Pacific, and sub-Saharan Africa. However, in recent years literacy rates have increased by more than 10 percent in those areas.
Source: United Nations Educational, Scientific and Cultural Organization (2006). "The Making of Literate Societies." Education for All Global Monitoring Report: Literacy for Life. Retrieved from http://www.unesco.org/new/en/education/themes/leading-the-international-agenda/efareport/reports/2006-literacy/
Source 4
Inventions and Discoveries
Below is a listing of major inventions or discoveries made between 1800 and the present.
| Year | Inventions | |
|---|---|---|
| 1800 to 1850 | Electric battery (1800)
Steam locomotive (1804) Canned food (1810) Spectroscope (1814) Photography (1816) Stethoscope (1819) |
Lawn mower (1830)
Sewing machine (1830) Electric telegraph (1833) Revolver (1835) Postage stamp (1840) Antiseptics (1847) |
| 1850 to 1899 | Elevator (1852)
Bicycle (1861) Plastic (1862) Dynamite (1866) Torpedo (1866) Typewriter (1868) Traffic light (1868) Telephone (1876) |
Movies (1877)
Light bulb (1870) Machine gun (1884) Automobile (1885) Drinking straw (1888) Radio (1895) X-ray (1895) Aspirin (1897) Paper clip (1899) |
| 1900 to 1949 | Vacuum cleaner (1901)
Airplane (1901) Assembly line (1908) Dixie paper cup (1912) Zipper (1913) Hair dryer (1920) Hearing aid (1923) Television (1923) |
Frozen food (1924)
Scotch tape (1926) Antibiotics (1928) Helicopter (1936) Guided missile (1942) Atomic bomb (1945) Transistor (1947) Computer (1948) |
| 1950 to now | Credit card (1950)
Robot (1954) Solar cell (1954) Video tape recorder (1956) Satellite (1957) Computer modem (1958) Microchip (1958) First human in space (1961) |
ATM cash dispenser (1969)
Internet (1969) E-mail (1971) Plastic bottles for liquids (1972) Laser printer (1975) Personal computer (1975) In-vitro fertilization (1978) Space telescope (1990) iPad (2010) |
Source 5
Vaccines and Disease
Vaccines produce immunity to disease by stimulating the production of antibodies. The first successful vaccine was developed by Edward Jenner in 1796 to help prevent smallpox. Since that time, people have developed many vaccines to fight serious and life-threatening diseases.
Below is a chart created by the National Centers for Disease Control in the United States. It shows the impact of vaccines on six diseases in the United States. The first column shows the disease. The second column, "Pre-vaccine estimated annual Morbidity Rates," provides the estimated yearly number of cases of each disease before vaccinations.
Remember that this chart refers only to the United States. According to the World Health Organization, there are still many children in the world not protected by vaccines and modern medicine. In 2012, the WHO claimed that each year, there are about 1.5 million children in the world who die from diseases that could be prevented by vaccines.
Impact of Vaccines on Disease in the United States
| Disease | Pre-vaccine estimated annual Morbidity Rates | 2010 Reported Cases | % Decrease |
|---|---|---|---|
| Smallpox | 29,005 | 0 | 100% |
| Diphtheria | 21,053 | 0 | 100% |
| Tetanus | 580 | 0 | 99% |
| Polio | 16,316 | 0 | 100% |
| Measles | 530,217 | 61 | >99% |
| Mumps | 162,344 | 2 | >99% |
Sources:
Table was modified from National Centers for Disease Control http://www.cdc.gov/vaccines/pubs/pinkbook/downloads/appendices/G/impact-of-vaccines.pdf
Information on global vaccination from World Health Organization. (2012). "Global Immunization Data." http://www.who.int/immunization_monitoring/data/en/
Source 6
Spread of Democracy
Carles Boix, a professor of politics and public affairs at Princeton University, has studied the growth in the number of democracies over the past 200 years. In the text below, he tells us something of what he has learned.
By 2000 there were around 100 democracies — almost twice the number in 1989 and about three times as many as there were just after World War II (see graph below). More recently,... democracies have kept cropping up at a steady rate.
The majority of mankind may indeed wish to live under free institutions.... But a look at history tells us a more cautionary tale about the chances of democratic progress. The chart below shows that still today, only slightly more than 50 percent of all sovereign states have a democratically constituted government. That proportion is not very different from the share of democracies in the peak years of 1920 and 1955.... Democratic practices appear fragile in the core of the former Soviet Union and in Latin America. And they remain elusive in most of sub-Saharan Africa and in the Middle East.
In the graph below, Dr. Boix shows the number and percentages of democracies in the world by year. The gray area shows the number of democracies while the line shows the percentage of democracies.
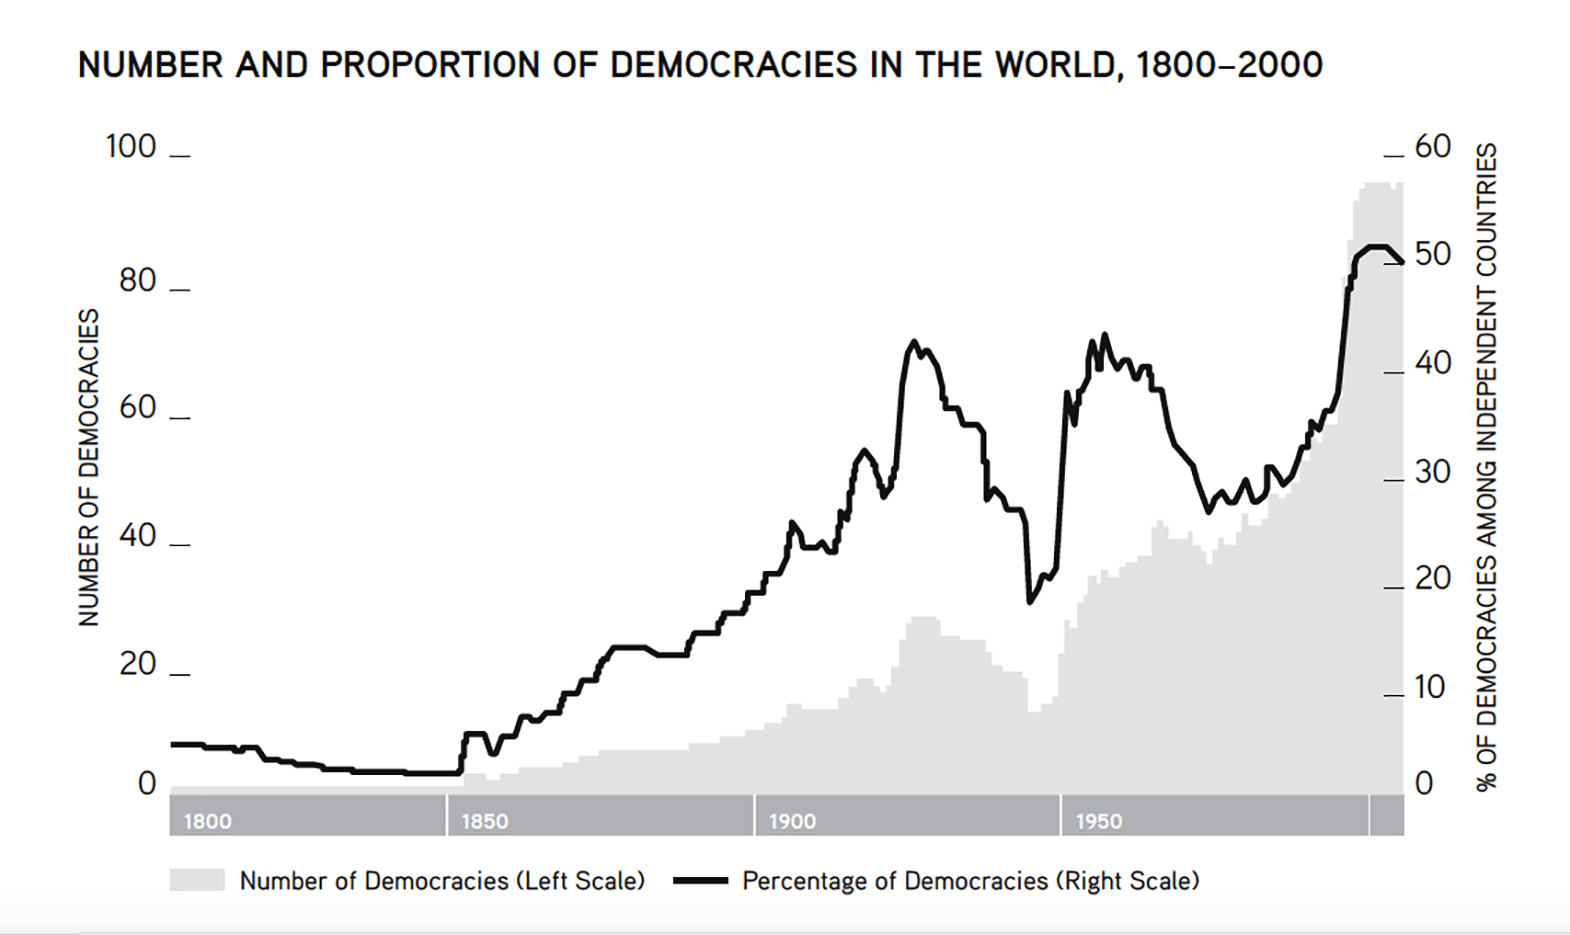
Source: Carles Boix, "The Roots of Democracy," Policy Review 135 (February 1, 2006).
Source 7
Wars and Killings by Governments
The Modern Revolution has provided governments new powers of mass communication and transportation, as well as new powerful weapons. Many governments have used these new powers to control their own populations or to wage war on other societies and peoples.
Below are two charts that describe two of the ways governments and nations have used the powers given them by the Modern Revolution. The first chart shows the number of wars between different types of governments.
The second chart shows the number of people killed by governments. When reading this chart it is important to remember that these are not soldiers killed during war, but civilians.
Wars Involving Democracies and Non-Democracies, 1816-1991
| Types of Combatants | Number of Wars |
|---|---|
| Democracies fighting democracies | 0 |
| Democracies fighting non-democracies | 155 |
| Non-democracies fighting non-democracies | 198 |
| Total Wars, 1816 and 1991 | 353 |
Mass Killings Committed by Governments, 1900-1989
| Type | Number of People Killed |
|---|---|
| Own citizens or people | 129,547,000 |
| Genocide | 38,566,000 |
| Total Murders by Governments, 1900 and 1989 | 169,202,000 |
Source: Charts modified from Israel W. Charney (ed.), Encyclopedia of Genocide (Santa Barbara, CA: ABC-CLIO, 1999) 24–25. This reference work includes essays from over 100 experts from many different countries on the Nazi Holocaust, the genocides in Armenia, Cambodia, Rwanda, and the former Yugoslavia, as well as on the Soviet prison system and other mass killings in the 20th century.
Source 8
Carbon Dioxide Levels Over the Last 10,000 Years
Carbon dioxide is a chemical compound composed of the elements carbon and oxygen, and whose chemical formula is CO2. Carbon dioxide is produced in the Earth’s atmosphere in a variety of ways. For example, animals, including humans, breathe in oxygen and exhale carbon dioxide. Burning fossil fuels also releases carbon dioxide into the air.
This chart showing carbon dioxide levels is from Skeptical Science, a blog written by John Cook, a scholar working at the Global Change Institute at the University of Queensland, Australia. He takes his information from peer-reviewed scientific journals.
It shows increases in CO2 levels. CO2 is the major greenhouse gas thought to cause global warming and climate change. The concentration of CO2 is increasing from decade to decade. According to a report in the journal Science, we would have to go back 15 million years to find levels as high as they are today.
Sources:
John Cook, “Are humans too insignificant to affect global climate?” Skeptical Science. 2012. Accessed 5 August 2012.
Aradhna Tripati et.al., “Coupling of CO2 and Ice Sheet Stability Over Major Climate Transitions of the Last 20 Million Years,” Science 326 no. 5958 (4 December 2009): 1394–97.
Rubric
 This work is licensed under a Creative Commons Attribution-NonCommercial 4.0 International License.