Grade 6-8 | Informative | Source-Based
Source Lexile®: 1110L-1320L | Learning Standards
Prompt
Today you will read three articles about earthquakes and the technology scientists use to monitor seismic activity. Write an essay explaining how the use of this technology is beneficial to humans and what are the advantages and limitations of this technology. Be sure to use details from all three articles to support your answer.
Source 1
"Seismograms: Earthquake Fingerprints"
By Dr. Jeanne Hardebeck, U.S. Geological Survey Earthquake Hazards Team
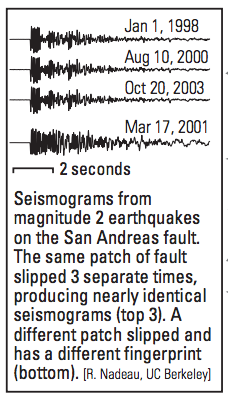 When a fault slips suddenly in an earthquake, it releases energy in the form of seismic waves. Captured by sensitive instruments, a seismogram is a recording of the shakes and jolts of these passing seismic waves. Seismograms are like the fingerprints of earthquakes with patterns that can be matched and decoded to learn about how earthquakes affect our world.
We know the earthquake's magnitude from the height of the waves, and we can figure out when and where the earthquake happened from the times the waves arrive at different places. The exact pattern of the wiggles is shaped by the individual earthquake: how deep it was, which direction the fault moved, and what kinds of rocks the waves passed through.
Most earthquakes have unique seismograms, like people have unique fingerprints. Some groups of small earthquakes have almost identical seismograms, which means that these earthquakes are repeats of exactly the same motion in exactly the same direction in exactly the same place.
We can find out even more about big earthquakes by breaking them down into smaller parts. For example, a magnitude 6.5 earthquake that hit Paso Robles in December 2003 released built-up strain over a fault area 20 miles long and 8 miles from top to bottom. You can think of this area as being like a quilt divided into individual patches. 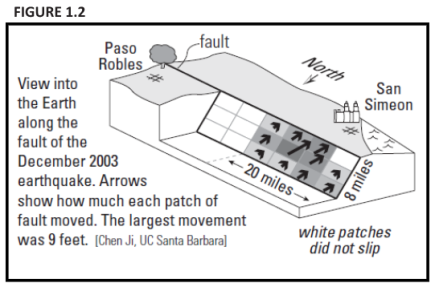 The movement of each patch has its own unique fingerprint. The seismogram of a large earthquake is then the combined fingerprints of all the patches. We use a computer to match patterns in the large earthquake's seismogram to figure out which patches of the fault moved and by how much.
Some patches of the fault did not slip much, so we can expect future earthquakes sooner there. Patches that slipped a lot already won't move again until plate tectonics causes the strain to build back up.
Source 2
"Bay Area Tsunamis: Are We at Risk?"
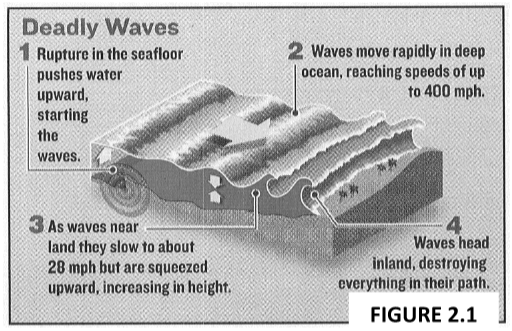
The infamous 1906 San Francisco Earthquake began when a tiny section of the 1300 km-long San Andreas fault began to rupture. That initial break known as the hypocenter occurred just offshore of San Francisco. Although most of the movement was strike-slip (with blocks of crust moving horizontally) there was a small amount of vertical movement. When the ocean floor moved down, it created a tsunami.
 Luckily for San Franciscans already suffering the effects of a major earthquake, the 1906 tsunami wasn't a large one. In fact, it measured only 10 centimeters high when it arrived at the San Francisco tide gauge station near Crissy Field. Does that mean there's no tsunami danger in the Bay Area? Not exactly! Our greatest tsunami danger comes from subduction zones similar to the one that generated the 2004 Indian Ocean tsunami, where one tectonic plate dives beneath another.
We have tsunami danger from another source as well: a local earthquake could trigger coastal or underwater landslides, potentially leading to dangerous waves. If you feel shaking, be sure to leave the beach, even if no official alerts you! What about that 10 centimeter 1906 tsunami? To scientists it was important; that single tide gauge record helped them to decipher how the offshore portion of the San Andreas fault moved during the Great 1906 Earthquake.
When an offshore earthquake occurs along a subduction zone, a large section of ocean floor moves vertically, generating a tsunami. Tsunamis from subduction zone earthquakes as far away as Alaska or Japan, for example, can hit Bay Area shores. In 1964, a large earthquake in Alaska caused waves 6 meters high in northern California, killing 11 people. Today, the West Coast/Alaska Tsunami Warning Center would alert authorities in time to evacuate coastal regions. Although San Francisco Bay is sheltered by its narrow entrance at the Golden Gate, tsunamis can still enter the bay and result in strong currents.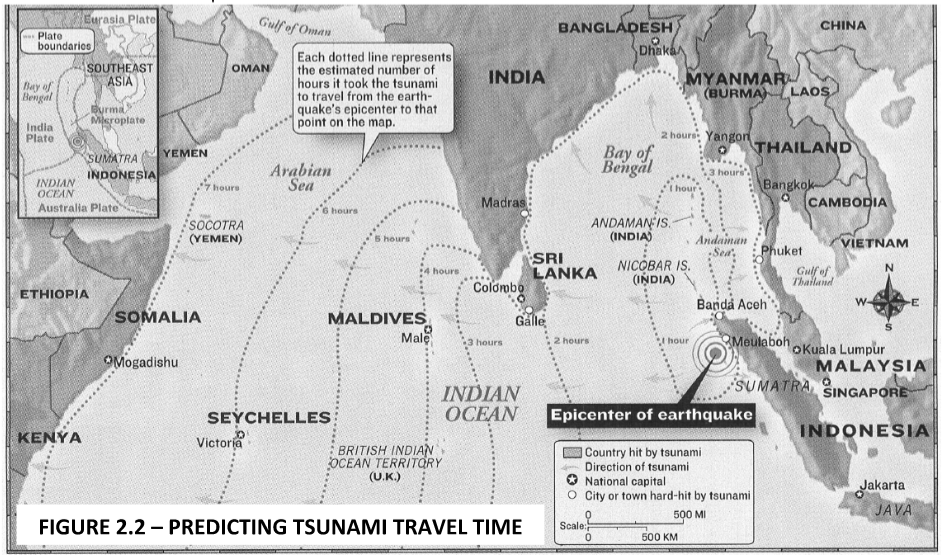
Eric Geist and Anne Rosenthal, U.S. Geological Survey Coastal and Marine Geology Program; Illustrations: McCabe, S. (2005, Jan 24). "OCEAN OF SORROW." Junior Scholastic, 107, 6-7.
Source 3
"Tsunami Warning System Flunks Test"
 Two Indonesian tsunami warning buoys, put in place after a 2004 earthquake and tidal wave killed more than 230,000 people, failed to activate on Oct. 25 when a 7.7 magnitude temblor hit the country's Mentawai Islands. This time, more than 800 died.
Even if the buoys had been operational, islanders would not have had enough time to evacuate, since the earthquake that triggered the tidal wave occurred too close to shore, according to the U.S. National Weather Service.
After the 2004 event, the U.S. National Oceanic and Atmospheric Administration donated two Deep-ocean Assessment and Reporting of Tsunamis (DART) buoys to monitor Indonesian and Thai waters at a cost of $800,000 each. One stopped reporting in March of 2008 and was declared lost at sea. The other stopped reporting in June 2010 when it broke free from its moorings. It was recovered in July, but not reestablished. "Operations and maintenance is the responsibility of the Indonesian government," said Susan Buchanan, spokesperson for the National Weather Service.
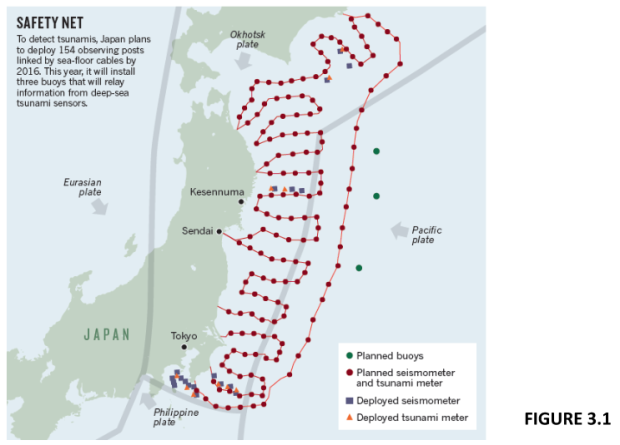
The buoys are part of a warning system that starts with measurement of seismic activity at the ocean floor. Strategically deployed buoys use automatic detection and reporting algorithms triggered by a threshold wave-height value to report activity that could confirm the forecasts from the seismic monitors. Data is transmitted by satellite and processed in real time in Alaska and Hawaii. The results determine when to issue watches, warnings or evaluations.
A September National Academy of Sciences report noted that, "ability to detect and forecast tsunamis has improved since the 2004 Indian Ocean tsunami, but current efforts are still not sufficient…for… tsunamis generated near land, which leave little time for warning."
Long, J. T. (2010). "Tsunami Warning System Flunks Test." ENR: Engineering News-Record, 265(13), 63.
Monastersky, R. (2012). "Tsunami forecasting: The next wave." Nature, 483(7388), 144. doi:10.1038/483144a
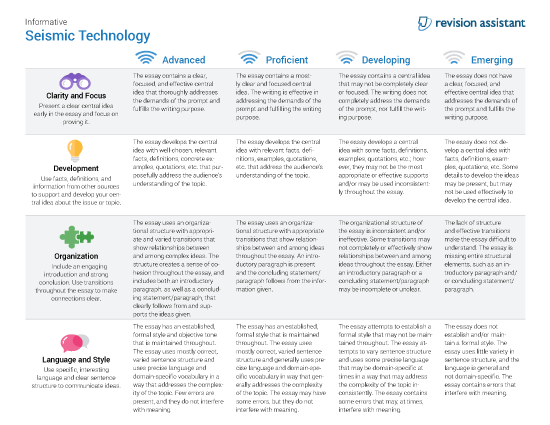
Rubric
 This work is licensed under a Creative Commons Attribution-NonCommercial 4.0 International License.