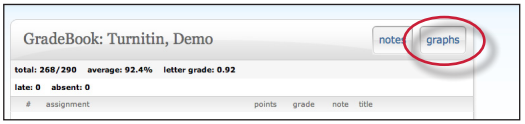
On the graphs page, the student will use the show pull down menu to select the graph type to view. 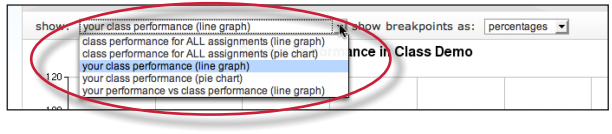
Student users can select from the following graphs available in line or pie chart formats:
- graphs showing class performance on all assignments
- graphs showing student performance for all assignments
- graphs comparing performance of this student to the class average
When viewing a line graph, a selection can be made to view grades as well as percentages. This is selected from the show breakpoints as drop down menu. Selecting grades adds the grades. The grades can be removed by selecting percentages.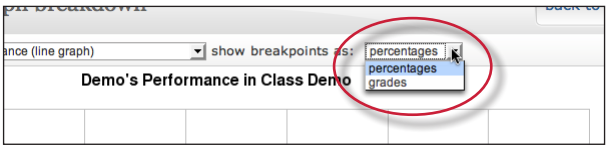
Was this page helpful?
We're sorry to hear that.
