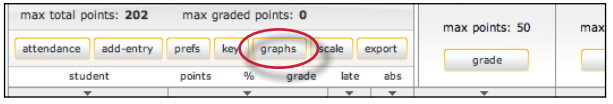
On the graphs page, use the show: pull down menu to choose what type of graph to display. The graph types available are:
- graphs showing class performance for all assignments
- graphs showing class performance for one assignment
- graphs showing performance of a student for all assignments or one assignment
- a graph comparing the performance of a student to the rest of a class
Most graphs are available in a line graph or as a pie chart.
When a graph for student performance or assignment performance is selected, a new pull down menu will appear labeled as for:, and the instructor will need to select a student or assignment to display, depending on the graph type that is being viewed.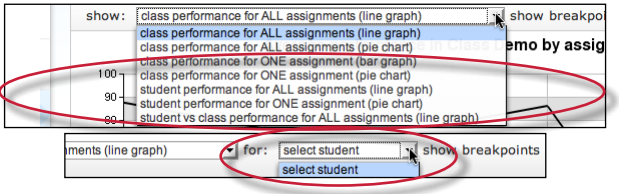
When viewing a line graph, the user has the option of showing grades instead of showing percentages. To show grades, use the show breakpoints as: pull down menu and select grades. To hide the grades and only display percentages, select percentages.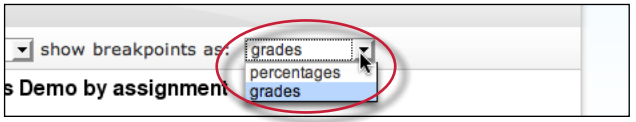
When viewing a bar graph for class performance in an assignment, an option is provided for viewing percentages or points. Use the break down distribution using: pull down and select percentages or points to change this option.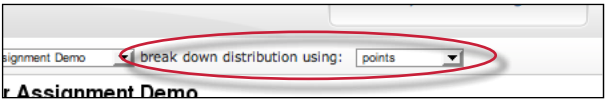
Was this page helpful?
We're sorry to hear that.
