Viewing submissions statistics
On your Administrator settings page, select Statistics from the Administrator side-panel to take you to the Statistics page.
- On the Statistics page, select your license type and data source, and set a date range.
If you need help selecting your license type, data source, and date range, check out the Accessing account statistics guide.
- Then, with your license, data source, and date range set, select the Submissions tab.
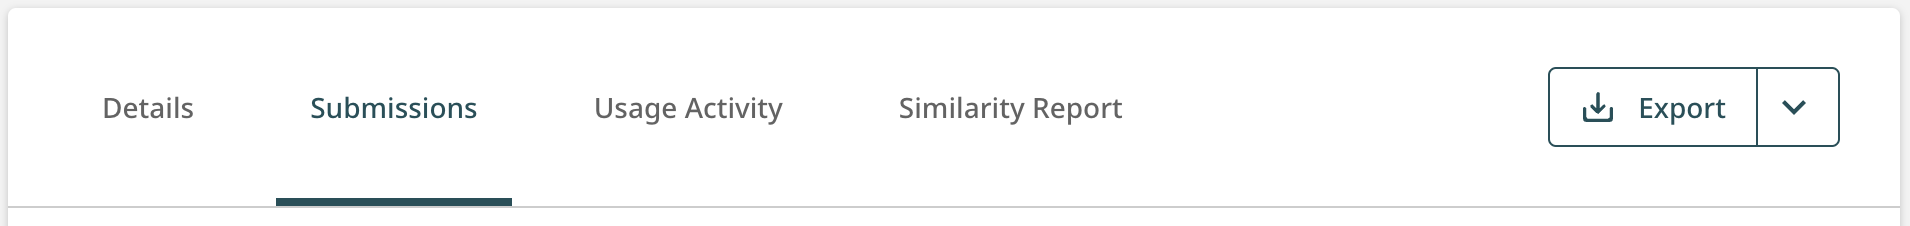
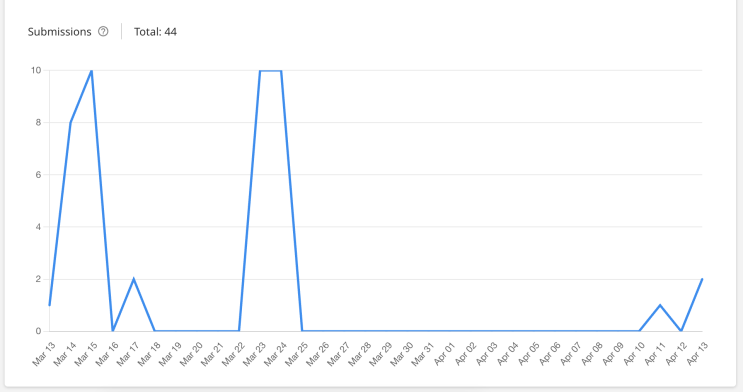
- Once you select the Submissions tab, the Submissions chart will appear. This chart is a visual representation of submissions that successfully generated a similarity report during your specified date range.
- To view the number of submissions your institution made to Turnitin on a specific day, hover and move your mouse over the data line to see pop-ups with specific submission numbers that correlate to the dates listed along the bottom of the chart.
Thank you! Your feedback will help us to improve this guide.
Was this page helpful?
We're sorry to hear that
If you have the time, we'd love to know how we could improve it.
The guide
